Profit warning: there will be blood
December 12, 2017
Shimshom Bichler and Jonathan Nitzan
The following research note first appeared on Real World Economics Review Blog.
We have just updated the charts in our 2014 RWER paper ‘Still About Oil?’, and the picture they portray reads like a capitalist call for arms.
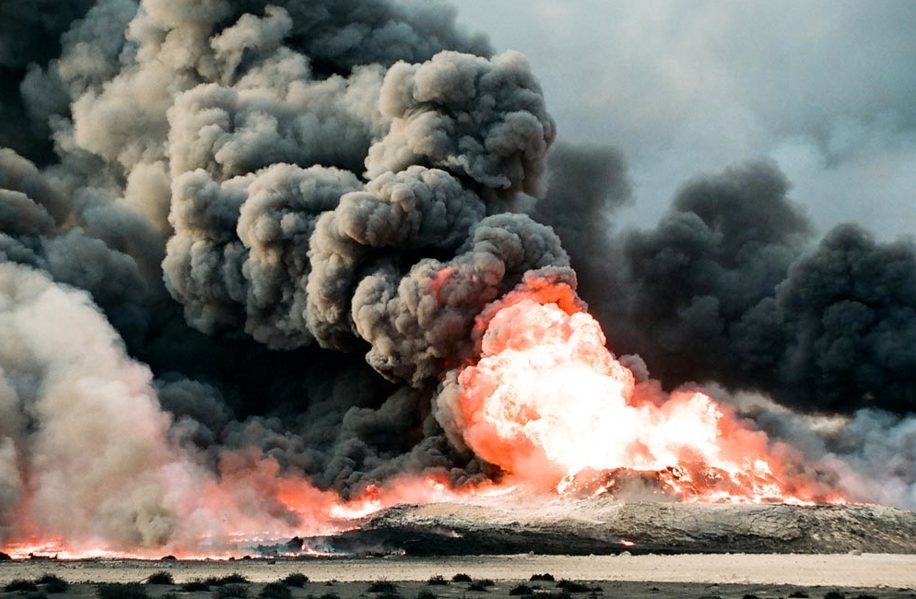
Beginning in the late 1980s, we suggested that, since the late 1960s, the Middle East was greatly influenced by the capitalized power of a Weapondollar-Petrodollar Coalition – a loose coalition comprising the leading oil companies, the OPEC cartel, armament contractors, engineering firms and large financial institutions – whose differential accumulation benefitted from and in turn helped fuel and sustain Middle East ‘energy conflicts’. These conflicts, we argued, reverberated far beyond the region: they affected the ups and downs of global growth, the gyrations of inflation and, in some important respects, the very evolution of the capitalist mode of power. And this impact, it seems to us, is now being called into question.
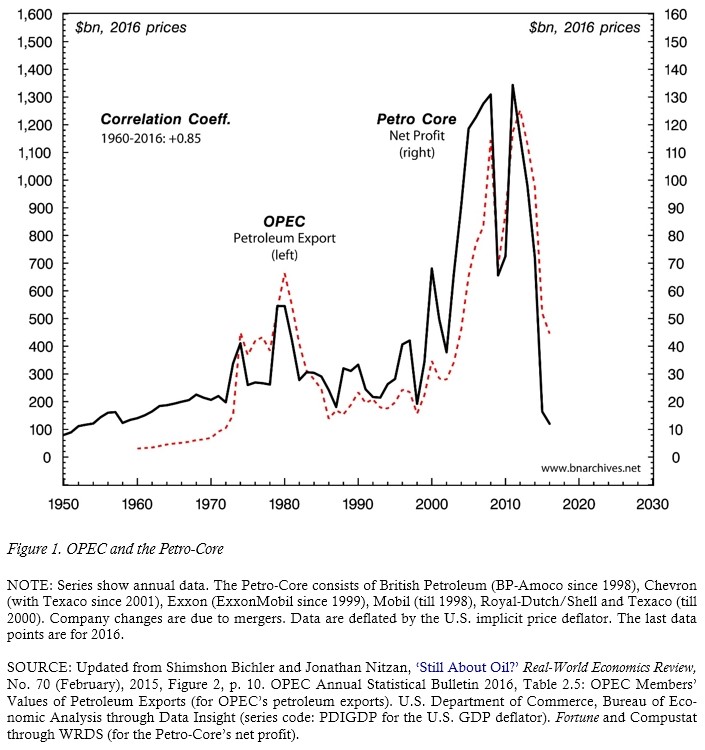
Over the past few years, oil incomes have crashed. Figure 1 shows that the leading oil firms – approximated by a ‘Petro-Core’ of listed companies – have seen their net profit in constant dollars plummet by over 90 per cent, falling from record highs in the early 2010s to lows last seen in the 1950s. The situation for OPEC is not much better. The organization’s overall petroleum exports, which reached record levels in the early 2010s, are now down by nearly two-thirds. The impact of this decline is greatly exacerbated by the organization’s rapid population growth – roughly 350 per cent over the past 55 years. Taking this latter growth into account means that, on a per capita basis, oil exports, expressed in constant dollars, are now back to where they were in the early 1970s, before the first oil crisis.
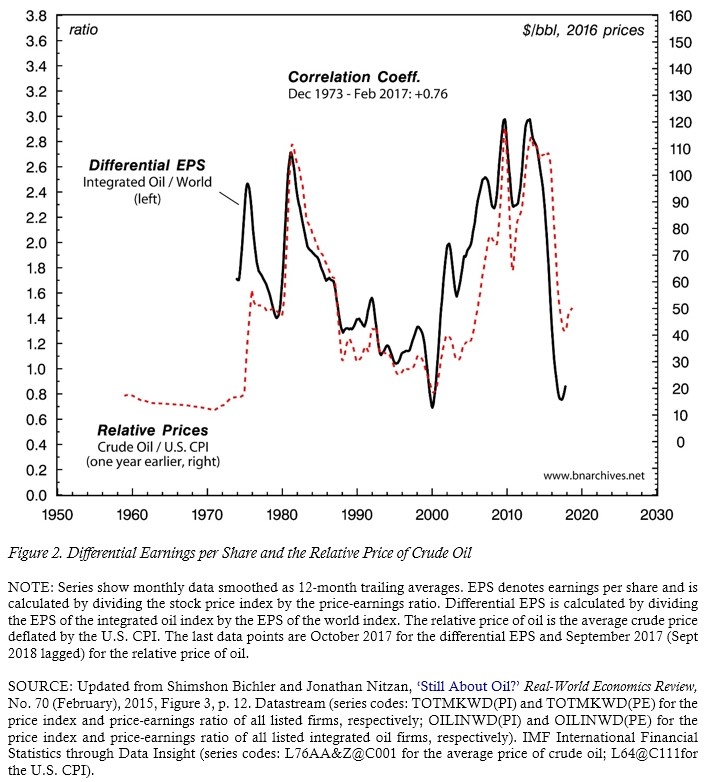
Clearly, this situation is unsustainable. To recover, the oil companies and oil exporting countries must see their incomes rise significantly, and as Figure 2 shows, such a recovery, if it were to happen, would require higher oil prices. The chart contrasts the differential earnings per share (EPS) of the global integrated oil sector (i.e., the sector’s EPS relative to the world’s EPS) with the relative price of oil (dollars per barrel deflated by the U.S. CPI) 12 months earlier (since ‘current’ EPS represents earnings recorded over the past year). As we can see, for nearly half a century, the correlation between the two series has been positive, tight and highly persistent (Pearson Coefficient = +0.76). And this pattern continues to hold today: over the past five years, the relative price of oil fell by 55 per cent, while the oil companies’ differential EPS sank by 71 per cent. Note, though, that in the last few months, both series show a small uptick. Could this uptick be the inflection point the Weapondollar-Petrodollar Coalition has been anxiously waiting for?
The answer is likely to depend crucially on future hostilities in the region. As Figure 3 shows, historically, relative oil prices tended to increase on the back of Middle East energy conflicts. The chart plots the differential return on equity of the Petro-Core relative to the Fortune 500: when the bars are grey, the Petro-Core beats the average (having a higher return on equity than the Fortune 500); when the bars are black, it trails the average (showing lower returns than the Fortune 500). These latter periods denote ‘danger zones’, indicating that the region is ripe for a new energy conflict. The actual eruption of such conflicts is marked by an explosion sign. The figure paints three important regularities:
- Every energy conflict save one was preceded by the Petro-Core trailing the average. In other words, for a Middle East energy conflict to erupt, the large oil companies first have to differentially decumulate (trail the average). The sole exception to this rule was the 2011 burst of the Arab Spring and the subsequent blooming of ‘outsourced wars’.
- Until 2014, every energy conflict was followed by the oil companies beating the average. As we have seen, differential oil profits are intimately correlated with the relative price of oil; the relative price of oil in turn is highly responsive to Middle East risk perceptions, real or imaginary; these risk perceptions tend to jump in preparation for and during armed conflict; and as risks mount, they raise the relative price of oil and boost the differential returns of the oil companies.
- With one exception, in 1996-97, the Petro-Core never managed to beat the average without a regional energy conflict. In other words, the differential performance of the oil companies depended not on production, but on the most extreme form of sabotage: war.

These regularities also seem to hold in Figure 4, where we focus not on the United States, but on the world as a whole; look not at the return on equity, but at the growth of earnings per share (EPS); and examine not annual but monthly data. The top two series contrast the average EPS performance of the world’s listed integrated oil companies with the average EPS performance of all of the world’s listed companies. Each series measures the annual rate of change of the respective EPS, computed by comparing any given month with the same month a year earlier and expressed as a three-year trailing average. The bottom series shows the differential EPS growth of the integrated oil companies, computed by subtracting the EPS growth rates of the world index from the EPS growth rate of the integrated oil index and expressing the result as a three-year trailing average. As in Figure 3, grey areas indicate periods during which the integrated oil companies beat the average, while black areas show periods in which they trail the average (and therefore mark a danger zone). Now although the definition and scope of these indices are rather different than those in Figure 3, the three stylized patterns – as well as the exceptions to these patters – are almost the same. Similarly to Figure 3, the chart shows that, since 1976: (1) all energy conflicts were preceded by the world’s integrated oil companies trailing the average (with the exception of the 2011 Arab Spring/outsourced wars and the 2014 third Gulf War, when differential accumulation was very close to zero, but still positive); (2) with the exception of the third Gulf war, all conflicts were followed by the integrated oil companies shifting to differential accumulation; and (3) except for the mid-1990s, the integrated oil companies have never managed to beat the average without a prior energy conflict.
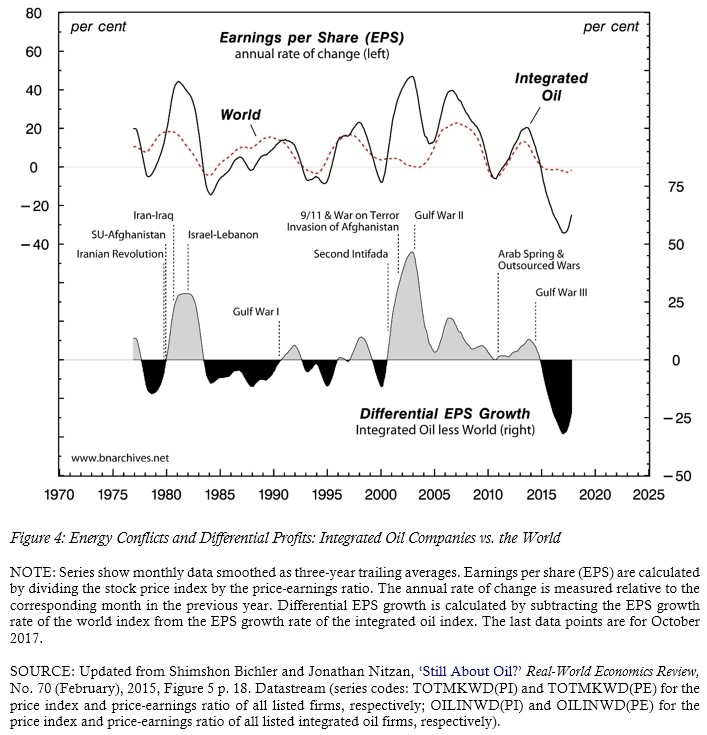
Situated against these long-term regularities, the experience of the past three years is highly exceptional. In line with the first regularity, the danger zone that opened up in 2013 was dully followed by the 2014 onset of the so-called third Gulf War. But then, for the first time in half a century, the first regularity was not followed by the second. Despite the ongoing hostilities – in Syria, Iraq and Yemen, among other places – and notwithstanding mounting regional instabilities hastened by dwindling petroleum export revenues, oil prices have plummeted, and the oil companies continue to trail the average. Moreover – and ominously – the magnitudes of the price drops and differential losses are unprecedented.
As we show in our recent research note ‘Blood and Oil in the Orient, Redux (2017)’, the Weapondollar-Petrodollar Coalition might no longer be in the Middle East driver’s seat. However, with the oil and armament companies, the region’s oil-exporting autocracies and various non-state groups all keen on seeing their oil incomes rise from record lows, the prospects of a new energy conflict, whether premeditated or coincidental, seem extremely high.
For the full research note: http://bnarchives.yorku.ca/525/